Technical Article
Corn Puff Production Line Yield: How to Measure Losses from Extrusion to Packing
A corn puff production line can appear productive while quietly losing material at start-up, die cutting, drying, seasoning and packing. The extruder may show a strong hourly output, yet the factory sells much less conforming packed product than the rated figure suggests.
The solution is not another estimate of “capacity.” It is a simple, repeatable mass-balance method that tells managers where material enters, where its water content changes, where saleable product is lost and which loss deserves attention first.
This guide is written for factory owners, production managers and project teams who need to compare shifts, verify a new line or improve an existing one. It complements our saleable-output capacity planning guide, which focuses on sizing a line before purchase. Here, the focus is actual factory yield after production begins.
Capacity and yield are not the same number
Before collecting data, separate four measurements that are often mixed together:
| Measurement | What it means | Why it matters |
|---|---|---|
| Gross throughput | All product leaving a machine during a measured period | Useful for checking machine load, but it includes off-spec and unfinished product |
| Conforming output | Product meeting the agreed size, expansion, colour, moisture and flavour limits | Shows whether process output is usable without rework |
| Saleable packed output | Accepted, sealed packs produced per scheduled hour | The output that can be shipped and invoiced |
| Material yield | Saleable product recovered from the measured material input | Reveals waste, hold-up, rejects, rework and unmeasured loss |
A line rated at a certain extrusion rate does not guarantee the same number of kilograms in saleable bags. Water is added during processing and removed in drying; oil and seasoning may be added later; some pieces are rejected; and the packaging section may run slower than the upstream equipment. These effects must be separated before a yield figure becomes useful.
Why wet-weight yield can mislead a snack factory
Suppose the factory compares kilograms of dry-mix input with kilograms of packed snack. That ratio looks simple, but it can move even when the true solid-material recovery has not changed. A wetter flour batch raises input weight. A higher final product moisture raises packed weight. Added oil and seasoning increase weight after drying. None of those changes automatically means the line recovered more corn solids.
For a meaningful comparison, record moisture at the main boundaries and convert wet mass to dry solids:
Dry solids (kg) = wet mass (kg) × [1 − moisture fraction]
For example, 1,000 kg of flour at 12% moisture contains 880 kg of dry solids. Moisture must be written as a decimal in the calculation: 12% becomes 0.12.
Then include other solid inputs such as oil and dry seasoning:
Total introduced solids = ingredient dry solids + added oil + dry seasoning solids
Packed product solids = accepted packed weight × [1 − final moisture fraction]
Dry-solid yield (%) = packed product solids ÷ total introduced solids × 100
This is a production-control calculation, not a laboratory standard. The factory should agree on its sampling method, moisture method and treatment of rework before using the result to compare operators, products or suppliers.
Build a measurement boundary around the whole line
A yield study fails when the start and finish points are unclear. Define one boundary from material issue to accepted packed product and record everything that crosses it.
- Inputs: flour, starch, minor ingredients, water, oil, flavour powder and any returned rework.
- Accepted output: correctly filled and sealed packs released by quality control.
- Measured losses: dust, spills, start-up scrap, off-spec pieces, dryer or conveyor breakage, seasoning collected by extraction, pack rejects and product used for samples.
- Inventory change: material remaining in mixers, hoppers, conveyors, dryer, seasoning drum, buffer bins and packaging hoppers at the start and end.
Do not label an inventory change as waste. Product left inside the line is still material, but it must be measured or estimated consistently. Otherwise a short trial will appear worse simply because more product remains in the equipment when the count ends.
Where to measure losses from extrusion to packing
| Process point | What to record | Typical loss or distortion |
|---|---|---|
| Batching and mixing | Issued ingredient weights, returned material, mixer residue and dust collection | Wrong issue quantity, spill, dust and unrecovered residue |
| Feeding | Timed feeder delivery, hopper level and line hold-up | Bridging, feed interruption, conveyor residue and unstable rate |
| Extruder and cutter | Stable-run output, start-up scrap, changeover scrap, die/cutter rejects | Off-spec expansion, tails, size variation, blockage and product collected during adjustment |
| Dryer and cooler | Entry and exit weight, moisture, breakage, scorch rejects and residual product | Water removal mistaken for material loss; excess fines or nonconforming moisture |
| Oil and seasoning | Oil and powder issued, returned powder, dust and finished-product pickup | Overspray, extraction loss, coating on equipment and excessive application |
| Packaging | Good packs, rejected packs, rework, average net weight and unsealed product | Film or seal rejects, checkweigher rejects, giveaway and product trapped in hoppers |
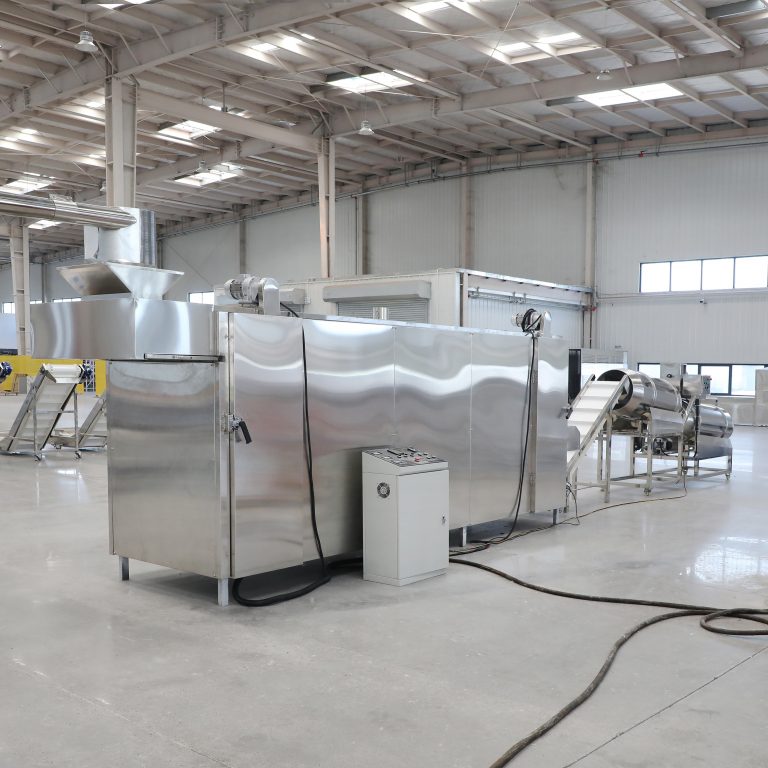
This map follows the practical structure of an extrusion system: controlled feeding and extrusion are followed by drying, cooling, coating and packing. Each stage changes either product condition or material ownership, so each needs a clear measurement point.
Run the study during a stable production window
Start-up data and stable-run data should not be mixed. Start-up loss is important, but it answers a different question. Use the following sequence:
- Select one formula, raw-material batch, die and pack size.
- Confirm the line is mechanically ready and all scales are checked.
- Record beginning inventory in hoppers, conveyors and work-in-process bins.
- Start production and collect start-up scrap separately.
- When output, appearance, motor load and moisture are stable, begin the timed measurement window.
- Record all inputs and collect samples at the extruder, dryer discharge and packing point.
- Count accepted packs, rejected packs, rework and retained quality samples.
- At the end, record remaining work in process using the same method as at the beginning.
- Reconcile the mass balance before changing settings.
For a continuous line, one short bucket test is not enough. Repeat timed samples at agreed intervals and compare the variation. A high average with unstable output may create more downstream loss than a slightly lower but steady rate.
Separate start-up, changeover and stable-run losses
A daily yield number is more useful when it is divided into operating states:
- Start-up loss: material used while temperature, feed, pressure, shape and moisture reach the approved condition.
- Changeover loss: material used to empty, clean, adjust or transition between formulas, dies or flavours.
- Stable-run loss: loss occurring while the line should be producing approved product.
- Shutdown loss: product remaining in or discharged from equipment at the end of a run.
This distinction changes the corrective action. Excessive start-up loss may be reduced with a repeatable start sequence and pre-set recipe. Stable-run rejects point more strongly to feeding, extrusion, cutting, drying or packaging control. High changeover loss may justify longer campaigns, better production sequencing or equipment designed for easier clean-out.
The dryer changes weight but should not hide solids loss
Drying is the stage most likely to confuse a yield report. The product should lose water, so a lower exit weight is expected. The correct question is whether dry solids are also disappearing through fines, breakage, scorching, spillage or unrecovered hold-up.
Record moisture and weight before and after drying. If dry-solid recovery is stable but wet-weight recovery changes, investigate moisture control first. If dry-solid recovery also falls, inspect transfer points, belt loading, fines collection and reject handling.
Also track product condition after cooling. Hot product can give a misleading impression of crispness, and moisture can redistribute before packing. If you are seeing texture or expansion defects as well as low yield, use the corn puff troubleshooting checklist to identify where the defect first appears.
Measure seasoning pickup, not only seasoning issued
Production records often show how much seasoning entered the department but not how much stayed on the product. Compare the weight issued with returned powder, collected dust, drum residue and the increase in product weight across coating.
A higher seasoning setting is not automatically a better result. Poor oil distribution, unstable product flow, incorrect application order or an overloaded drum can increase powder loss while the snack still looks uneven. Track seasoning kilograms per 100 kg of accepted packed product and investigate large shift-to-shift changes.
Packaging giveaway is a real material loss
When every bag is slightly heavier than the control target, the line may produce fewer saleable packs from the same batch even though no product is found on the floor.
Packaging giveaway (kg) = [average actual net weight − control target weight] × accepted pack count
Use the factory’s legal and quality-control rules when setting the target. The objective is not underfilling. It is to reduce unnecessary variation so the process can meet requirements without an excessive average overfill. Check feeder consistency, product bulk-density variation, weighing-head setup and packer timing. Our snack packaging machine guide explains why pack size, product behaviour and upstream output should be specified together.
A practical one-shift yield sheet
| Field | Required record |
|---|---|
| Production identity | Date, shift, operator, formula revision, raw-material lot, die and pack size |
| Scheduled and running time | Planned minutes, actual stable-run minutes and reason-coded stoppages |
| Material inputs | Wet weight and moisture of major ingredients; water, oil, seasoning and rework added |
| Process checks | Repeated extruder output, motor load, dryer settings, moisture and bulk density |
| Accepted output | Good pack count, average net weight and total accepted packed weight |
| Losses | Start-up, changeover, off-spec, fines, spills, samples, packing rejects and shutdown material |
| Inventory change | Beginning and ending work in process |
| Calculated KPIs | Dry-solid yield, saleable kg/scheduled hour, reject percentage and giveaway |
| Action | Largest confirmed loss, owner, due date and verification result |
Prioritise losses by value, not by visibility
The largest pile of visible scrap is not always the largest financial loss. Rank each loss using four questions:
- How many kilograms or packs are lost per shift?
- What is the material and processing value at that stage?
- How frequently does the loss occur?
- Can it be reduced without damaging product quality or line stability?
A small continuous packaging giveaway can exceed a dramatic but infrequent start-up reject. Likewise, a dryer bottleneck that forces the extruder to run below its stable range can reduce saleable output without creating an obvious scrap pile.
Know when the problem is a setting and when it is a bottleneck
Settings should be investigated first when the line has previously produced the same formula and pack reliably. Check raw material, calibration, cleaning, wear, operator sequence and actual readings before changing hardware.
An equipment or line-balance review is justified when repeated stable trials show that:
- feeding cannot hold the required rate without surging;
- the extruder reaches its motor or product-quality limit before target output;
- the dryer cannot achieve target moisture at the required bed loading;
- conveying creates excessive breakage or cannot buffer normal process variation;
- seasoning or packing cannot accept the practical upstream output; or
- clean-out and changeover losses remain structurally high.
In those cases, send the supplier the mass-balance sheet, time-stamped operating data and samples—not only a statement that “capacity is low.” Evidence allows the feeder, screw configuration, die, dryer, conveyor or packaging section to be evaluated against the real constraint.
Use yield measurement during FAT and commissioning
A factory acceptance test should define more than gross extruder output. Agree in advance on the formula, product limits, stable running period, measurement boundaries, acceptable packed output, treatment of start-up material and unresolved-item process. The food production line FAT checklist can be used to structure that agreement.
During commissioning, repeat the yield study with factory raw materials and actual packaging. This creates a baseline for future shifts and prevents later arguments caused by comparing different formulas, moisture levels, sampling periods or definitions of “output.”
Technical references
- NC State Extension: Extrusion Processing—A Versatile Technology for Producing Foods and Feeds
- ISO 22400-1: Key performance indicators for manufacturing operations management
- FAO: Guidance on mapping and measuring food and drink waste
- FAO: Business management guidance for small-scale agro-processors
Ask for a line based on saleable output
For a new corn puff project, send ZEKO the raw-material formula, target product and pack sizes, required saleable output, expected operating hours, utilities and factory layout. For an existing line, add the yield sheet, current bottleneck and photos or video of the loss point. We can then evaluate the complete process rather than quoting an isolated extruder.
View the Corn Puff Production Line Request a Production Line Proposal
Continue Reading